
")
- Details
- Category: Meters
- Published: Sunday, 06 November 2016 15:01
- Hits: 15339
Graphic SWR meter
for FloraFauna activators
not only
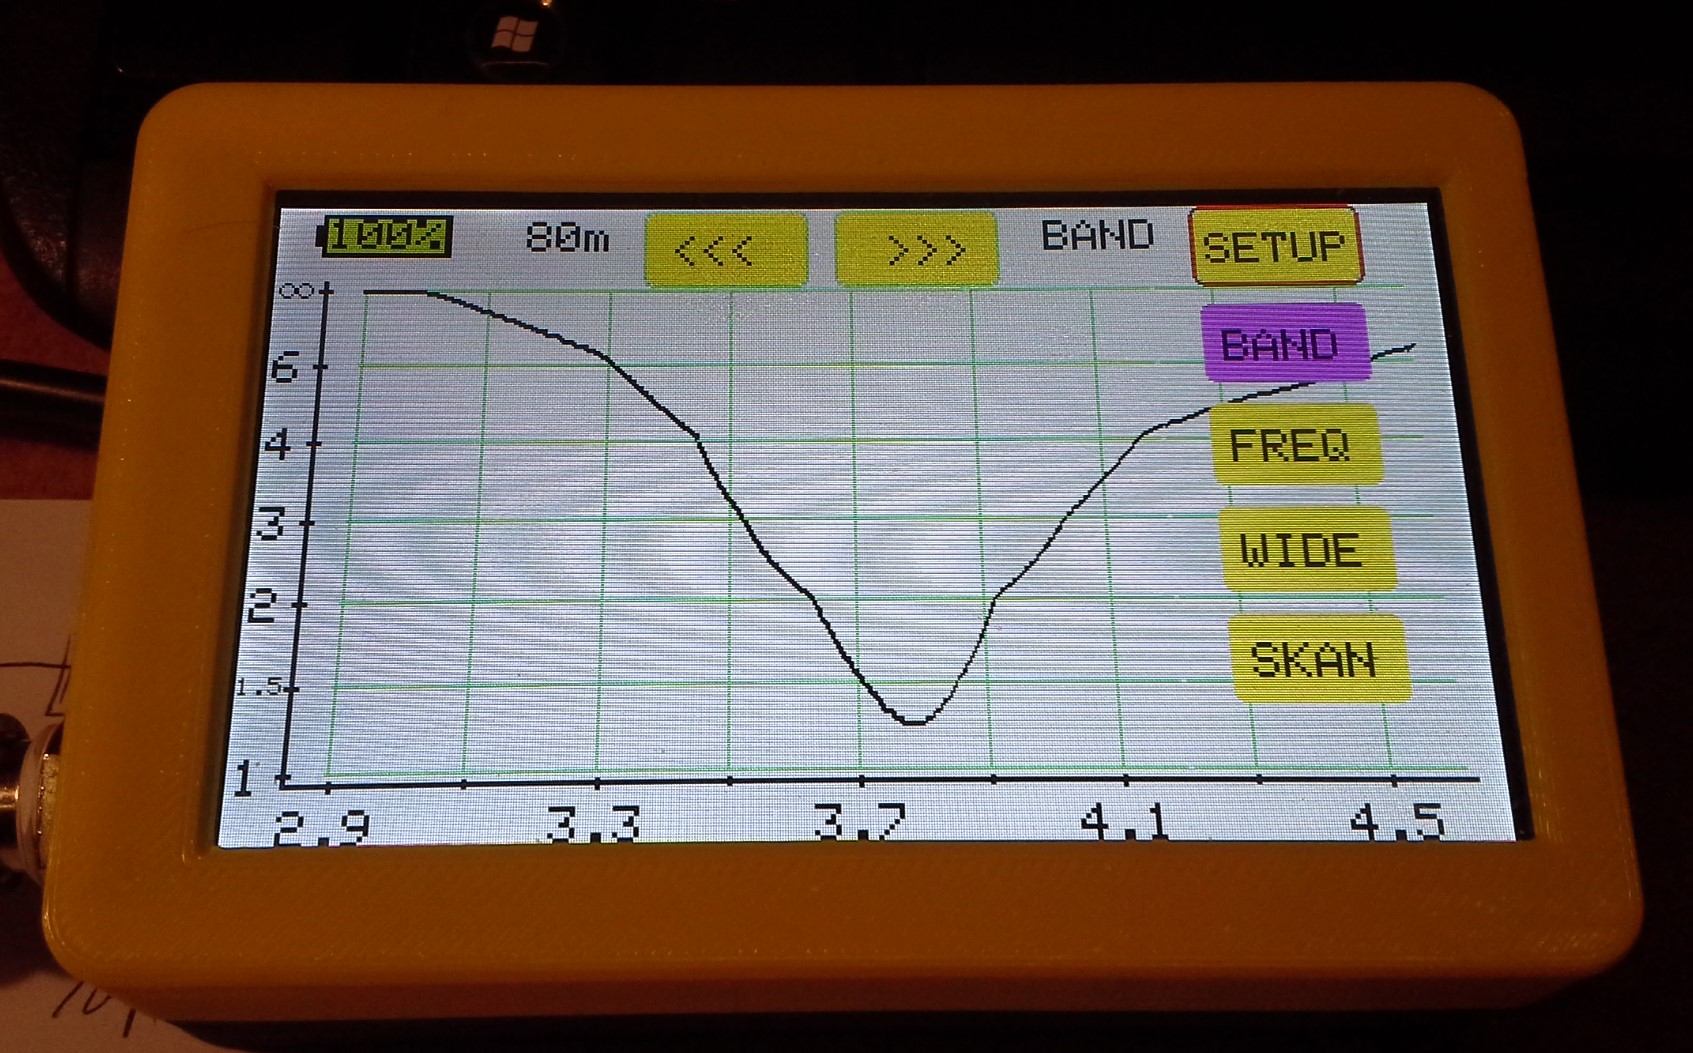
The device is designed to graphically illustrate the SWR.
Frequency range 1-30Mhz
Display color touch screen 4 "resolution 480/200
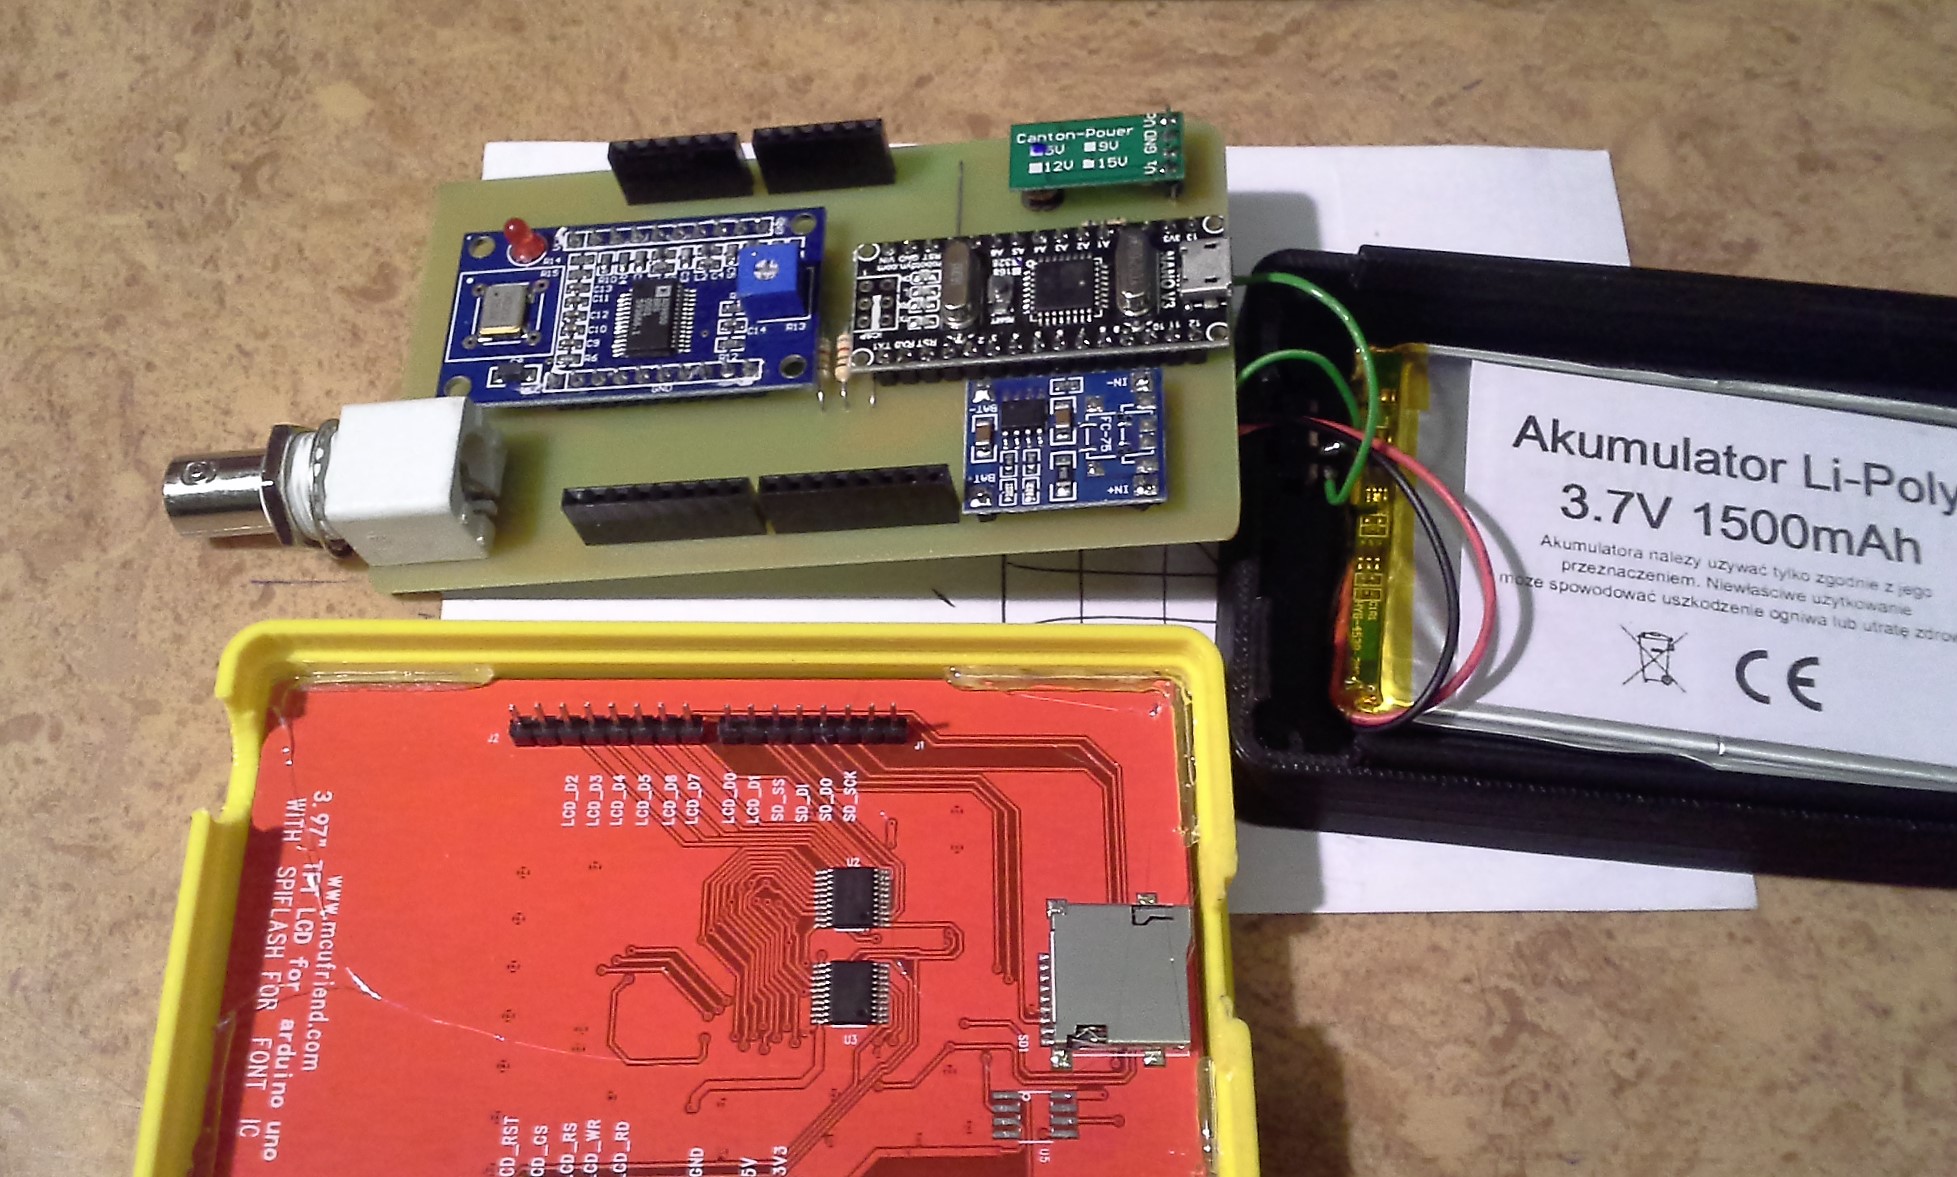
Power supply - internal battery Lipo 1500mA
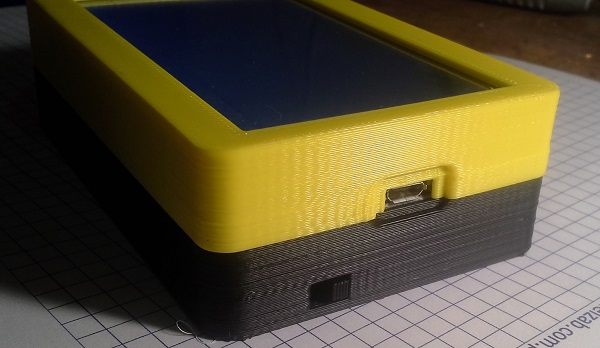
Charging connector Micro USB 5V
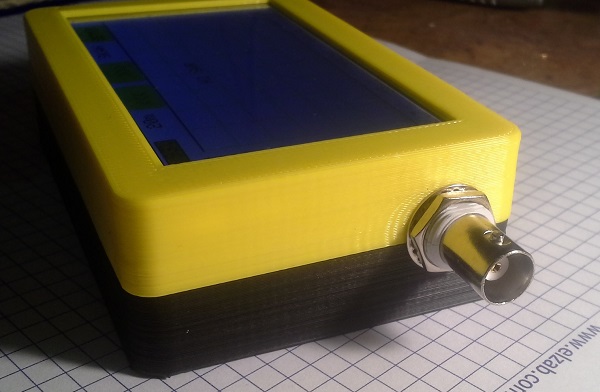
Antenna socket BNC adapter + UC1
Dimensions 105x69x32
The device consists of a few ready-made modules:
arduino nano v3, DDS AD9850 / 51, step-up power supply 5V, charger, Li-ion
and a few components on the motherboard
Operation:
Setup button opens the menu functions
BAND keys << >> change the band (from 160m to 10m)
FREQ - frequency change (move the graph to the right or to the left)
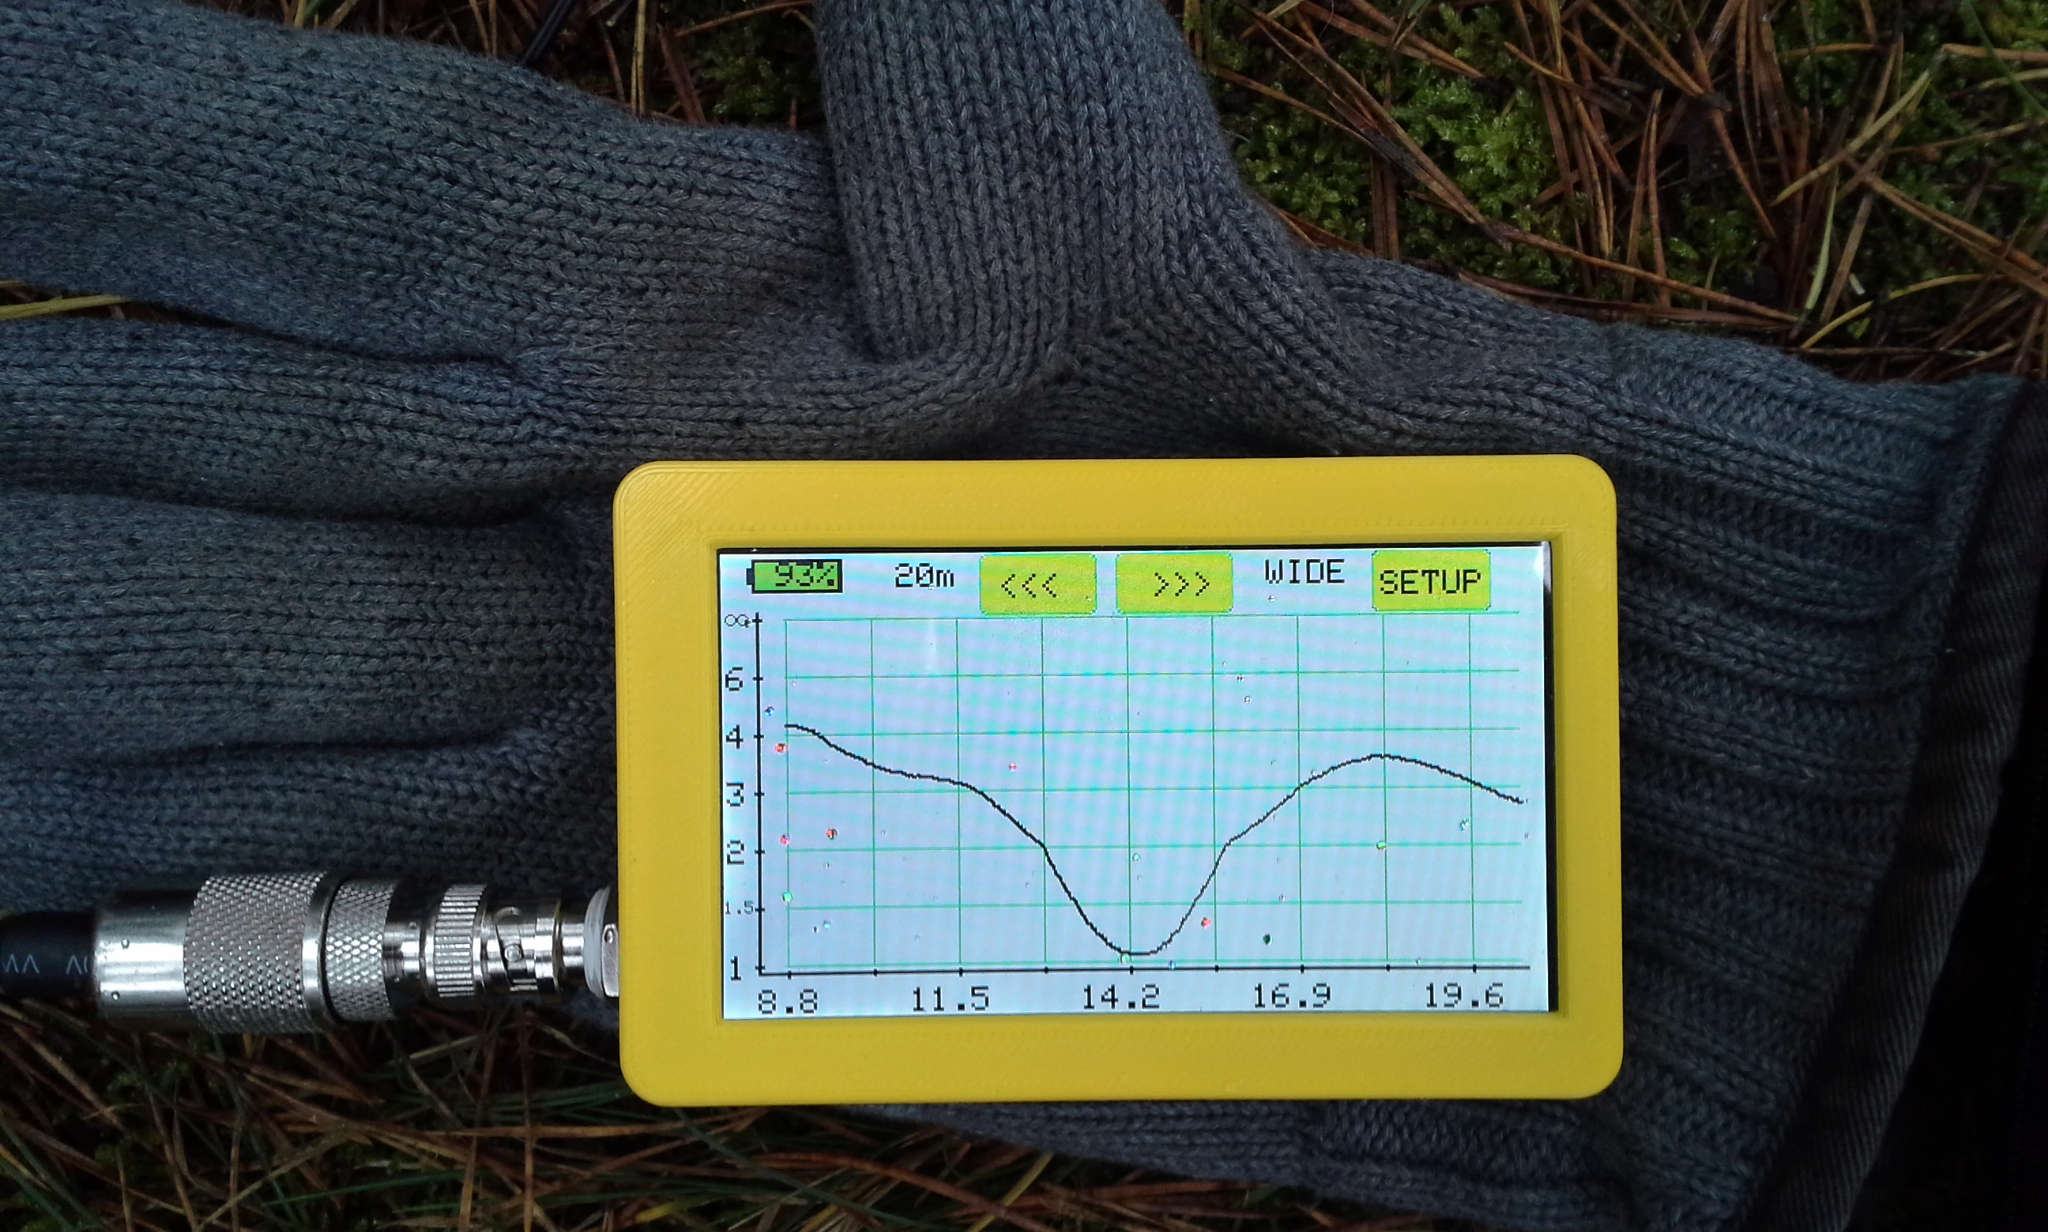
WIDE - change the scan range (bandwidth)
SCAN - function searching a minimum, sets the graph in the middle of the screen and shows the digital value of the SWR and frequency where the minimum is.
When the SCAN is stil on << >> keys are changing band, and doesn't turn off this function.
In addition to the 9 BANDs, there is also ANT1 and ANT2, you can freely define the frequency and width of the scan, and it will be saved
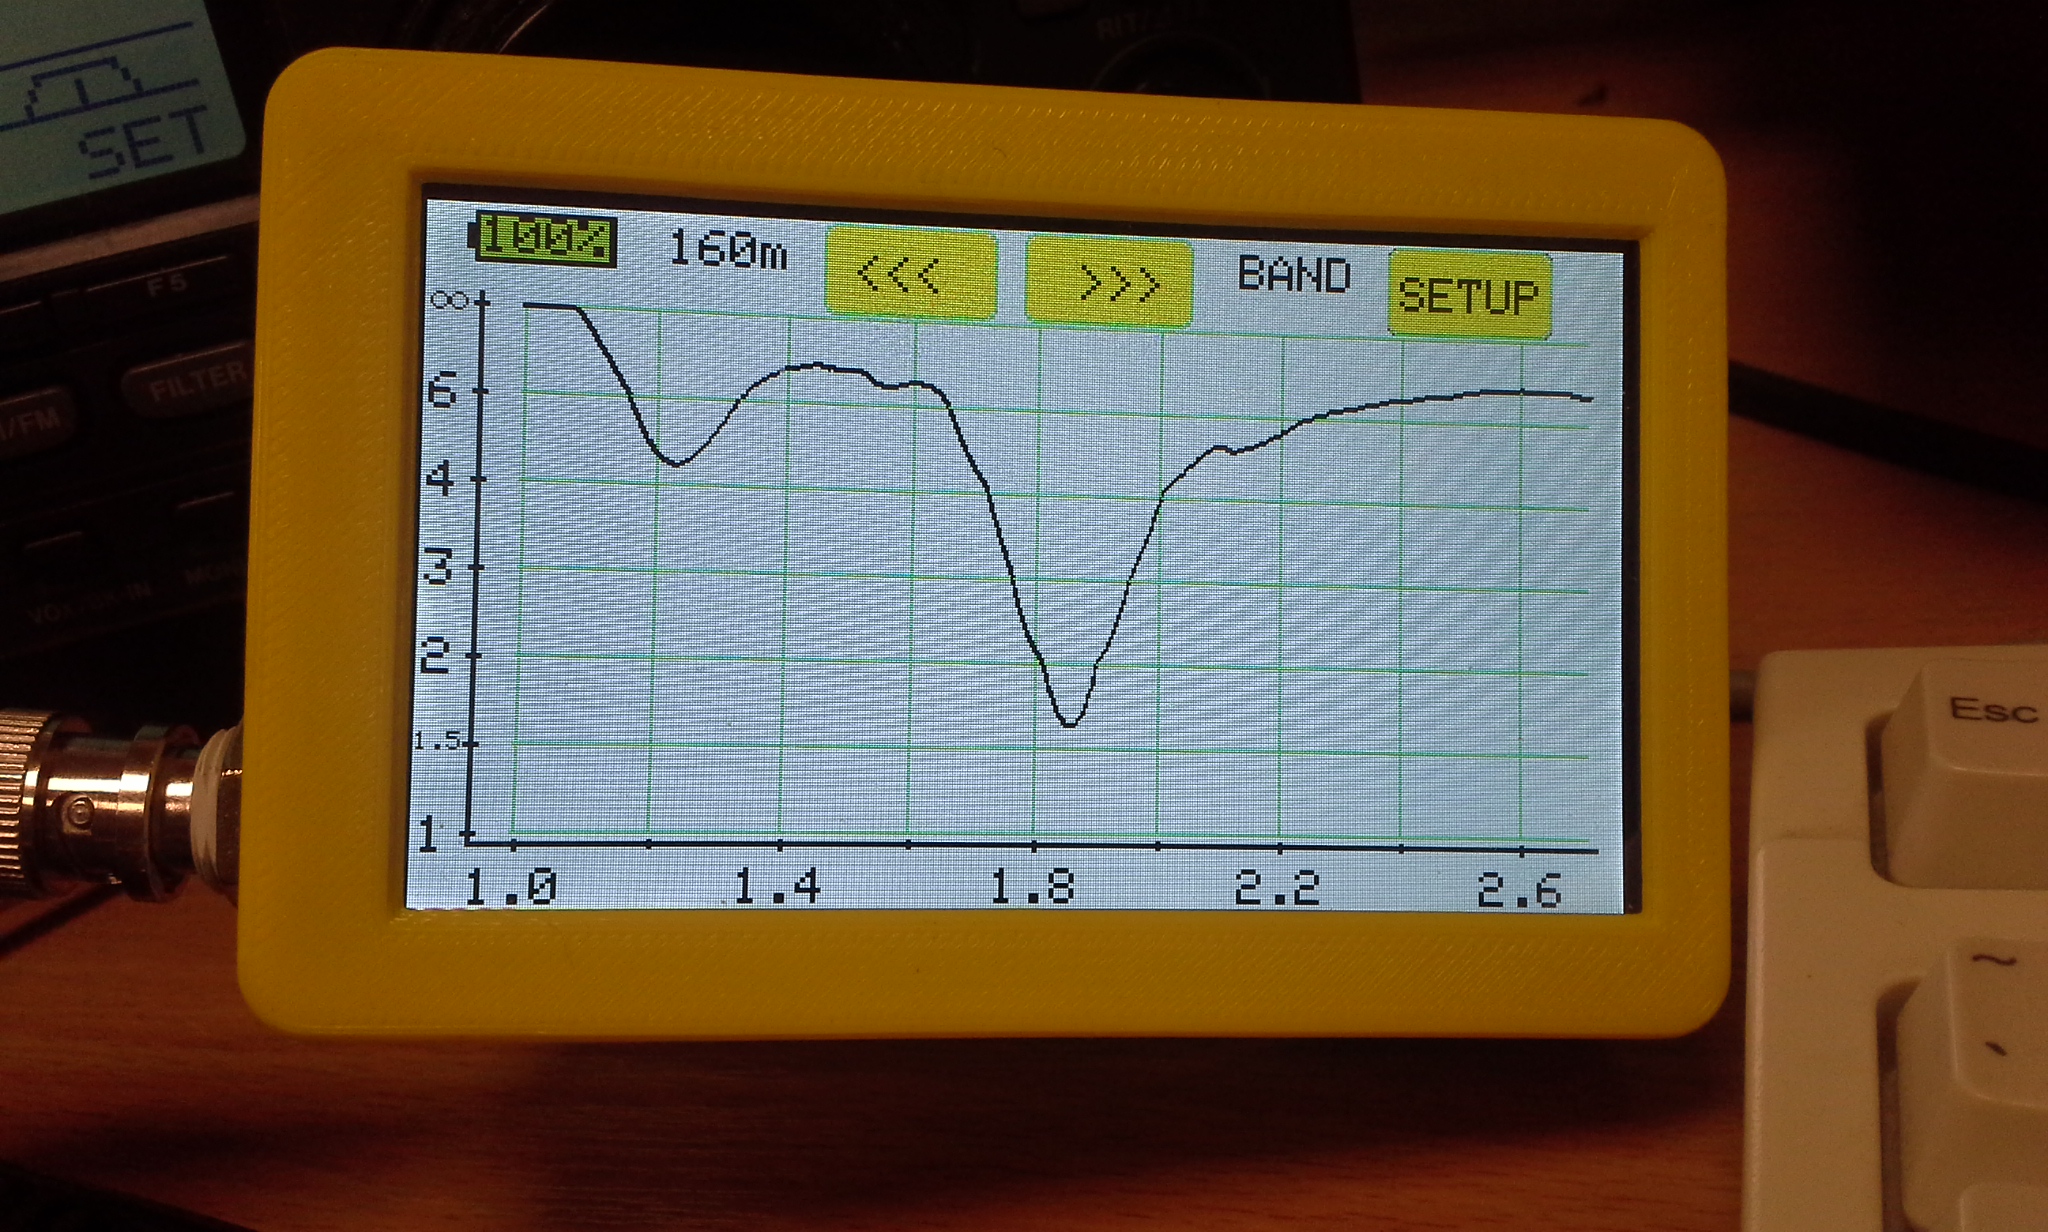
Dipol 160m
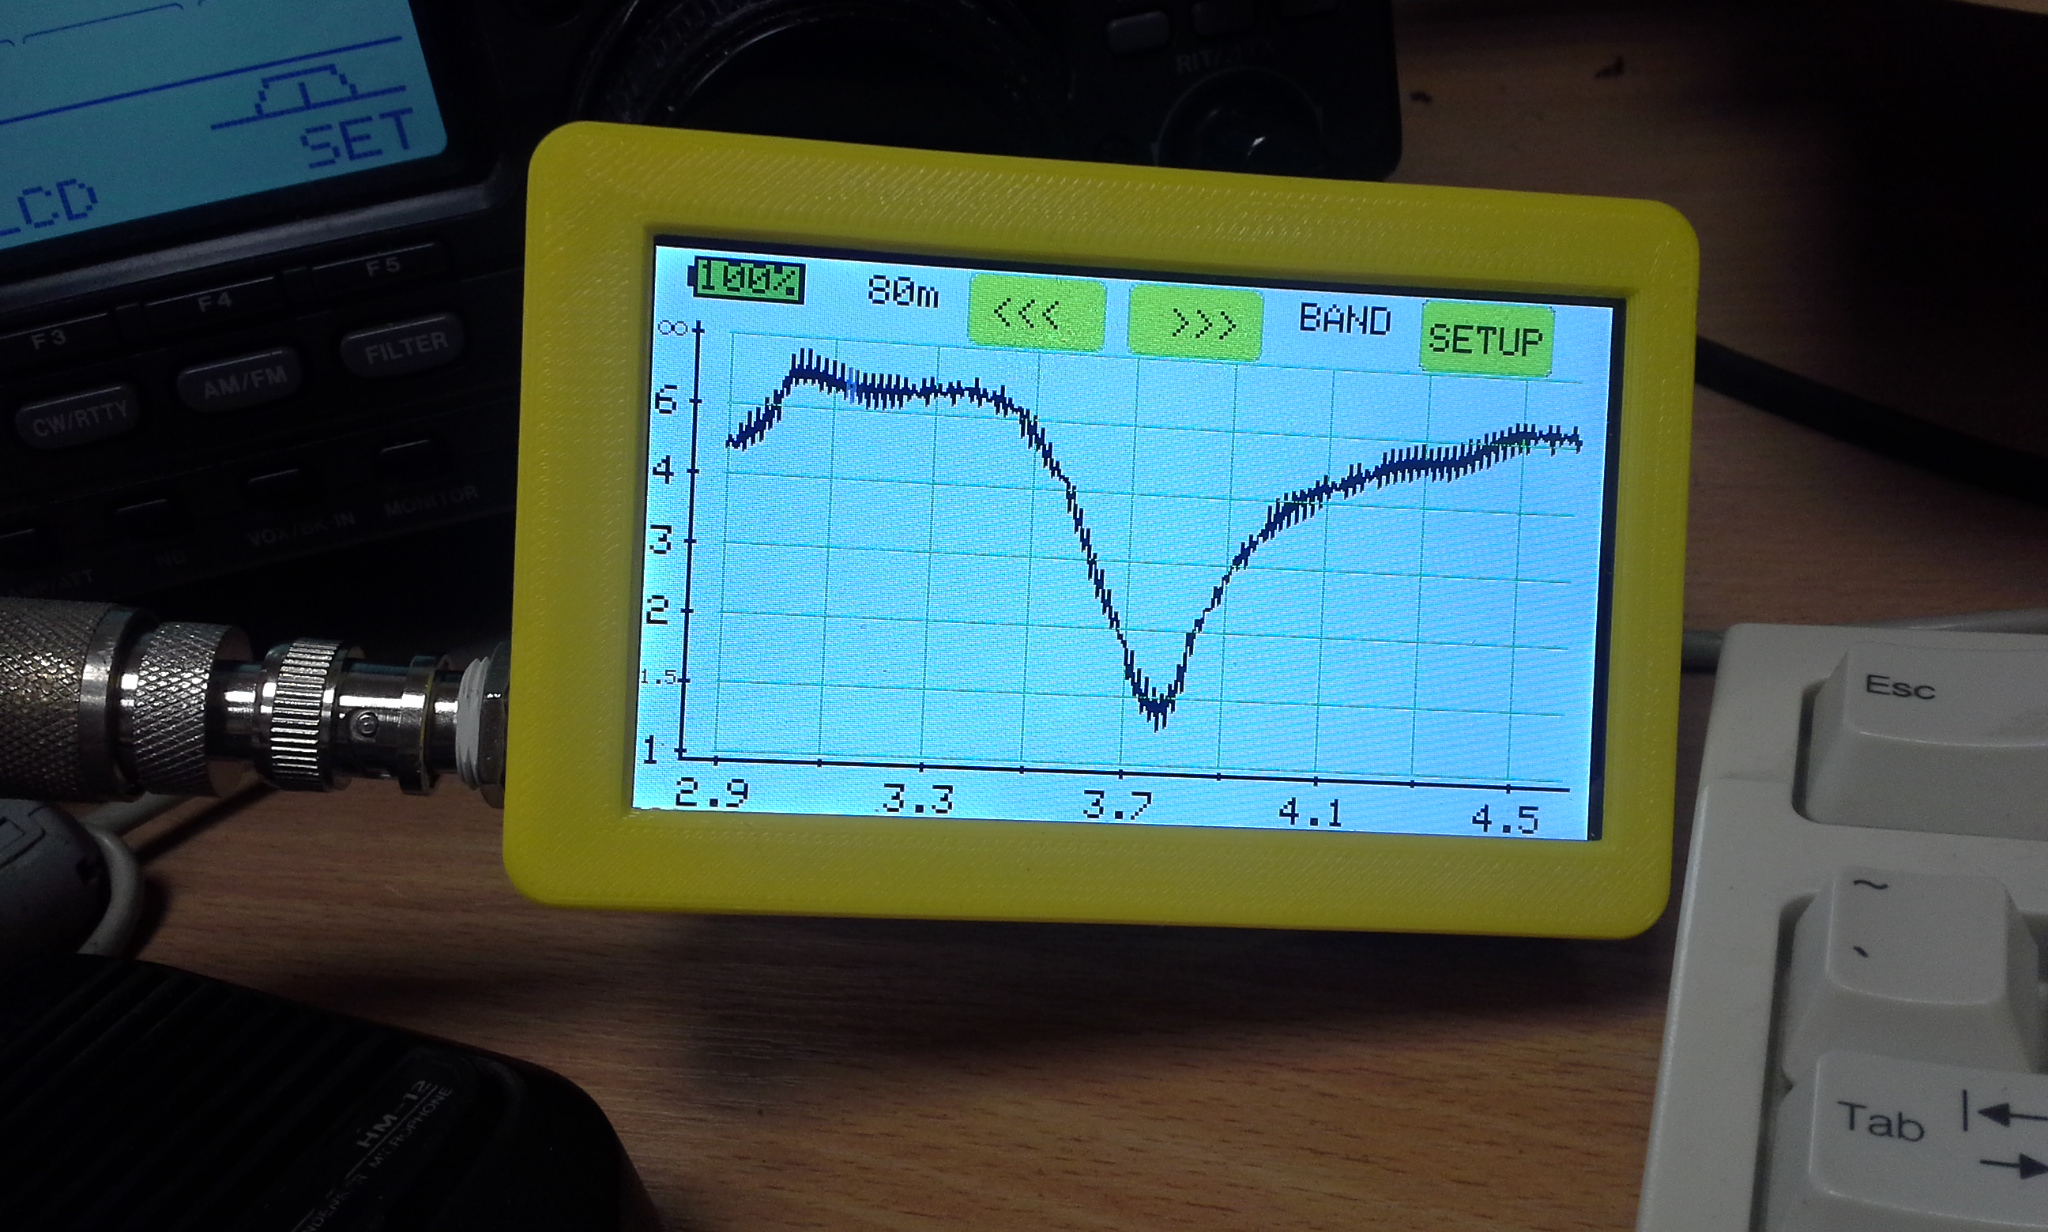
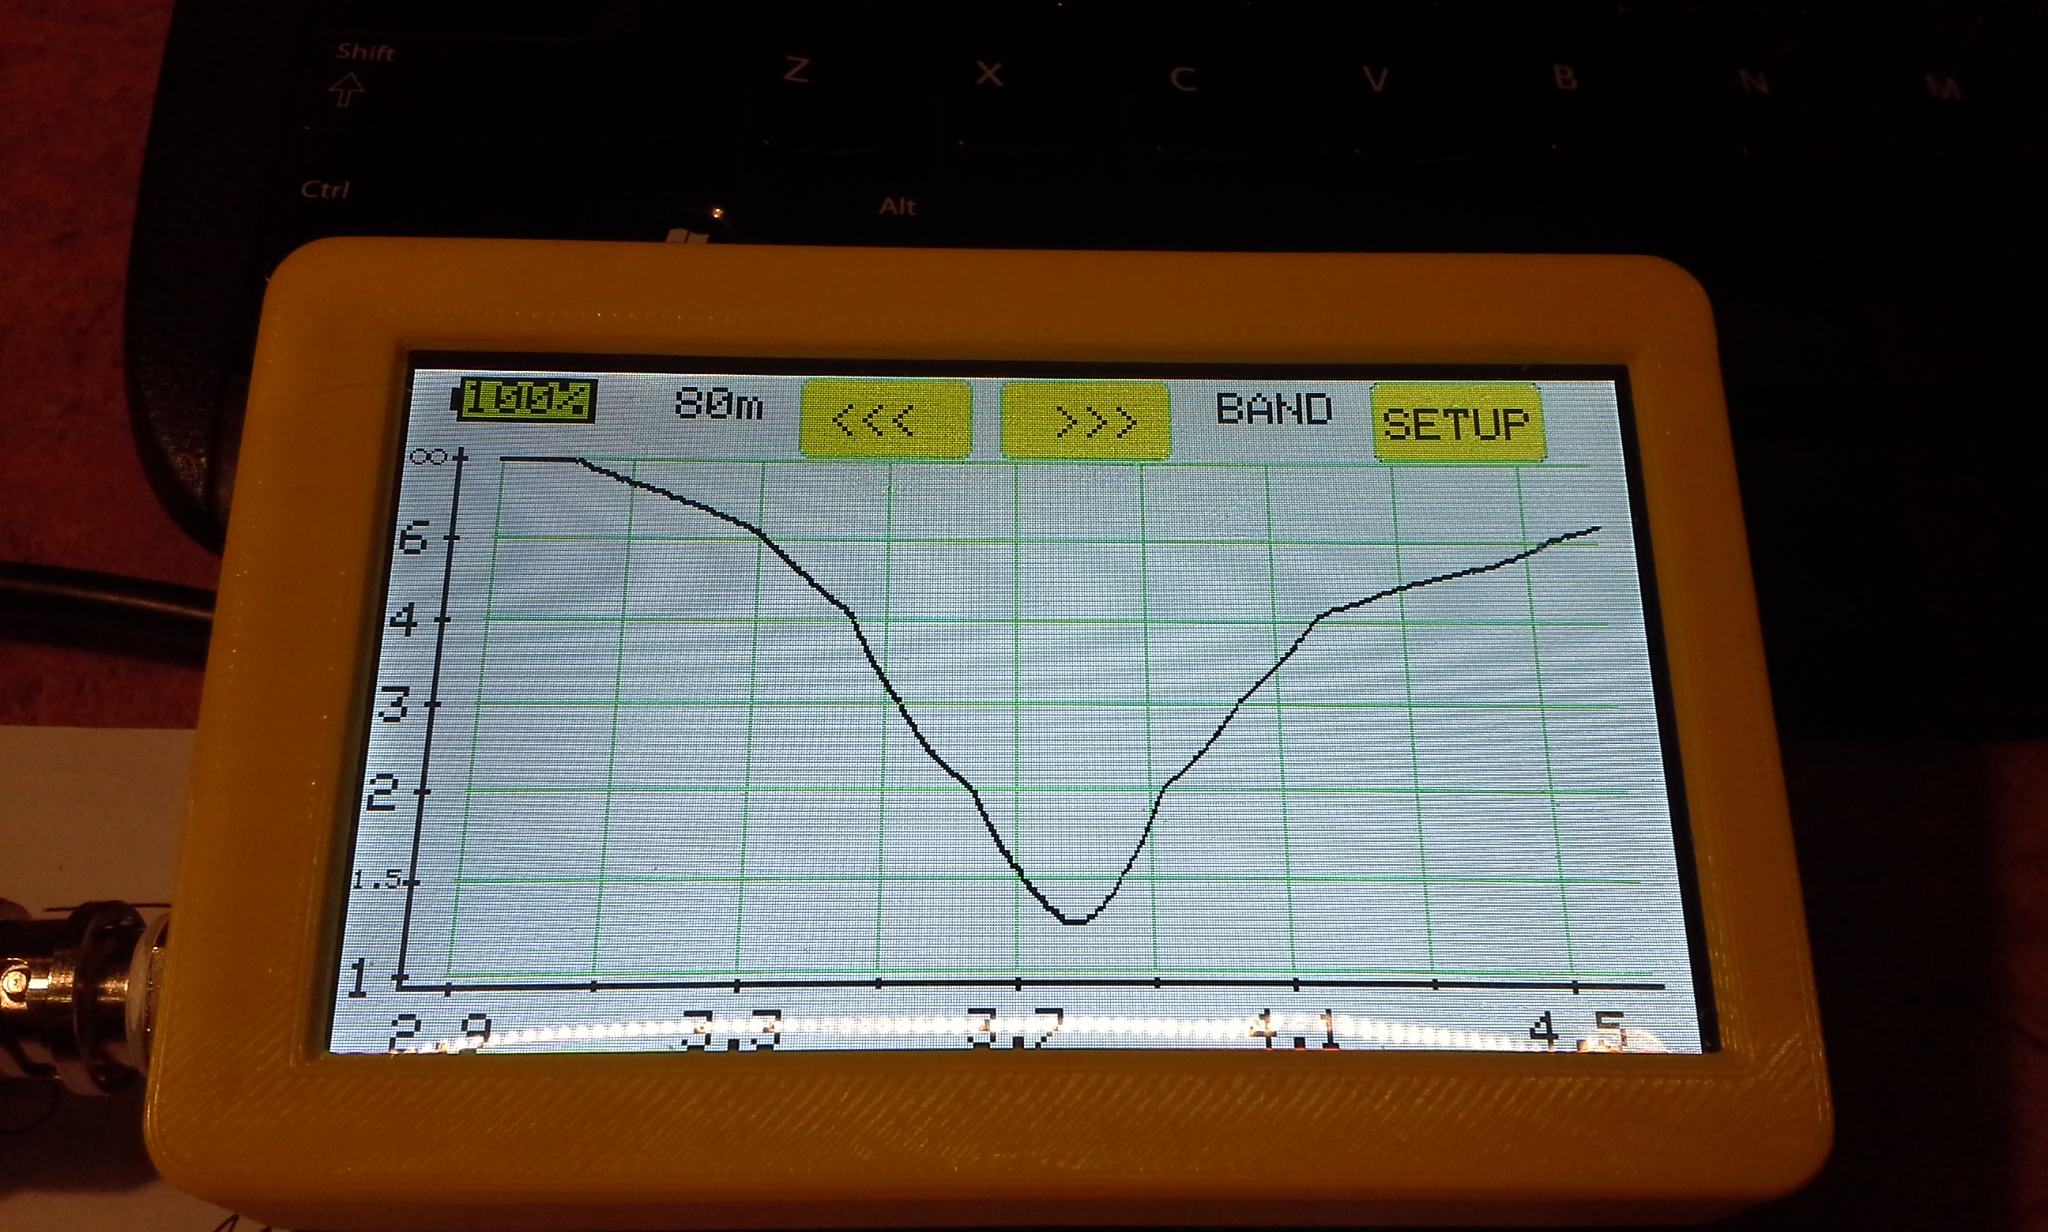
Dipol 80m
Not working well and it shows on the meter, or something of the balun is happening or rusted bolts
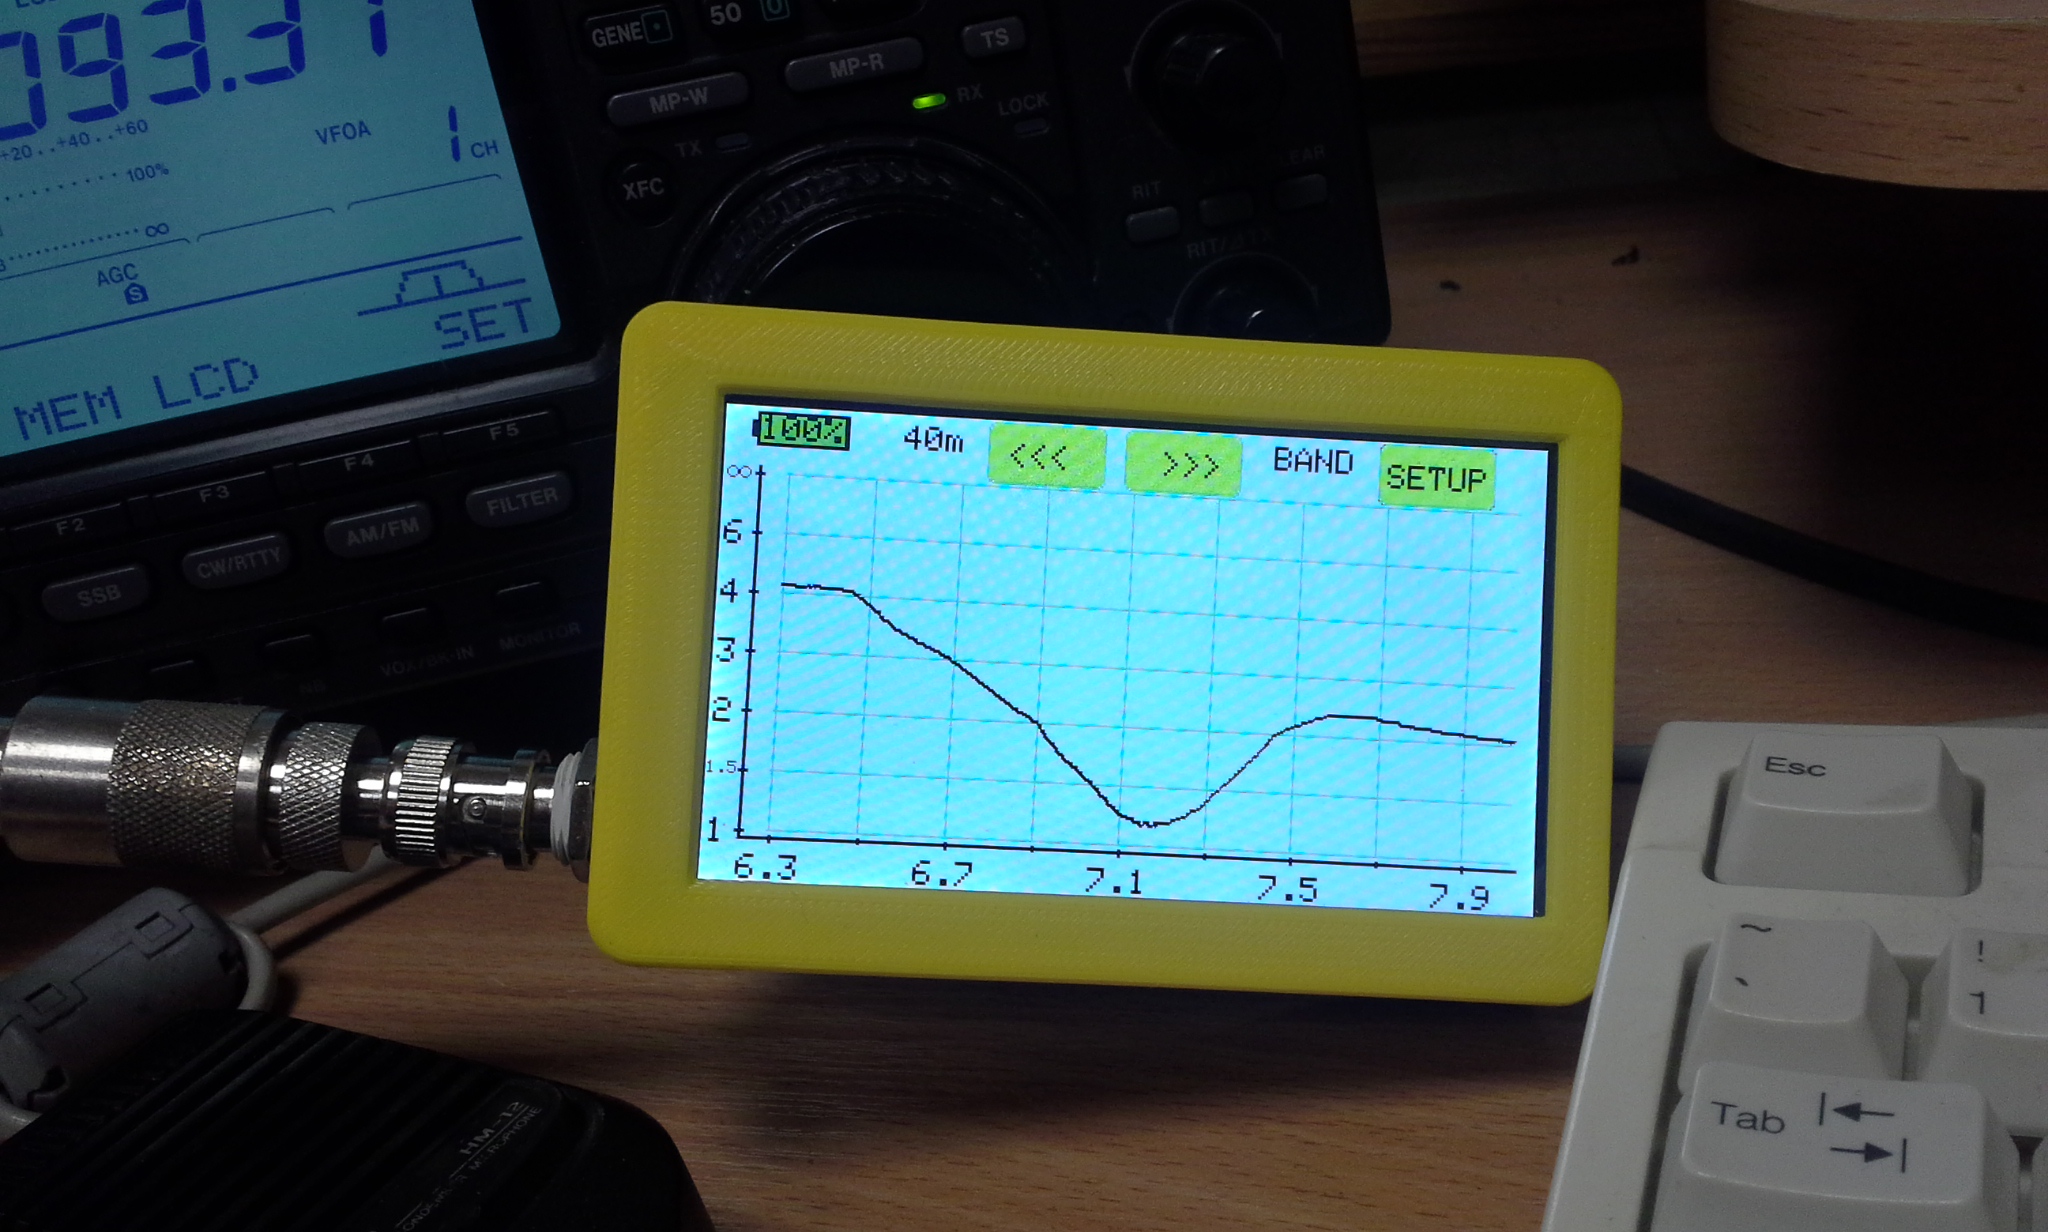
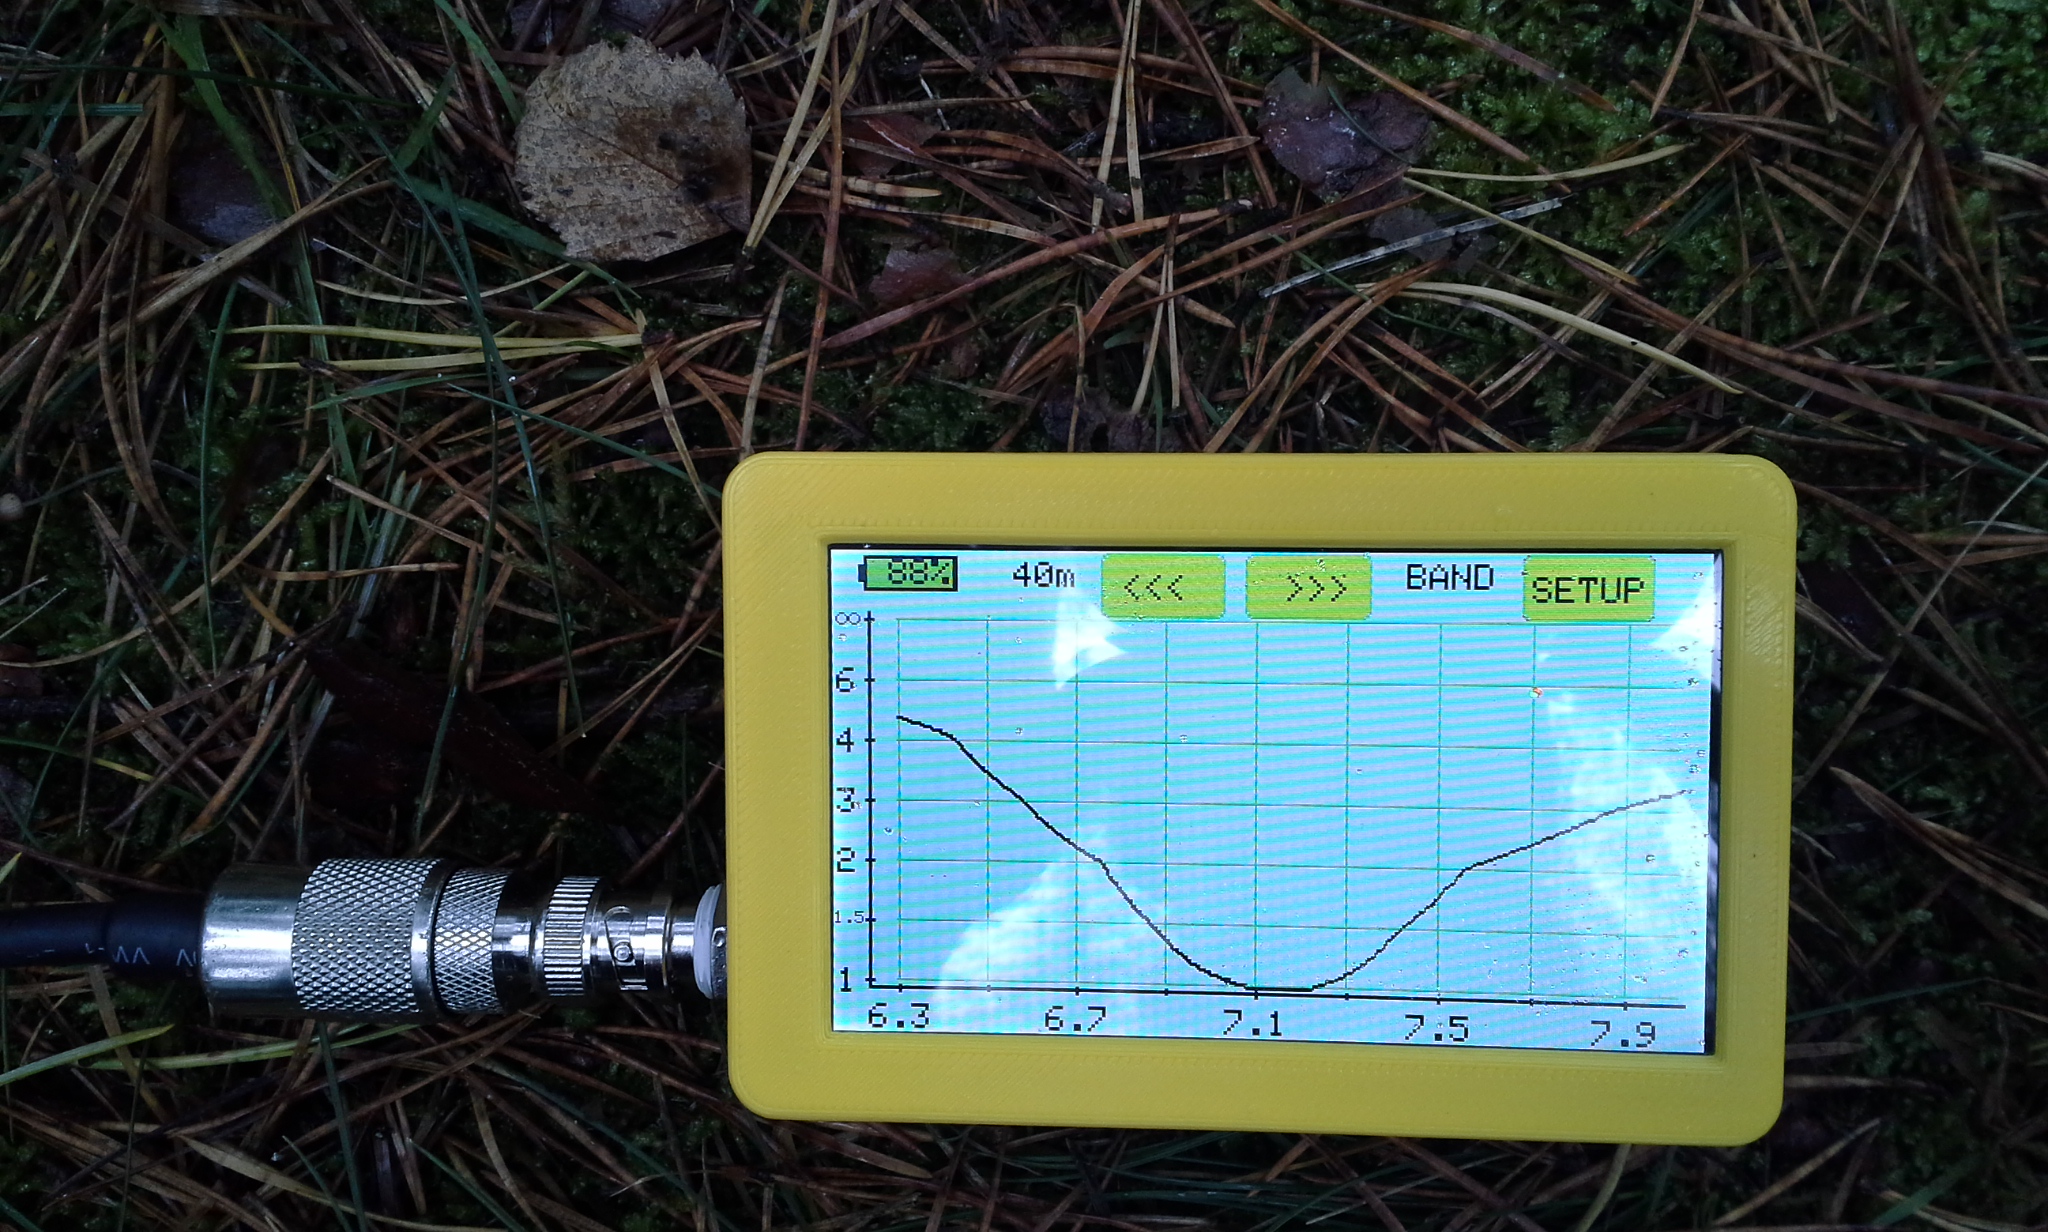
Dipol 40m
It works very well.
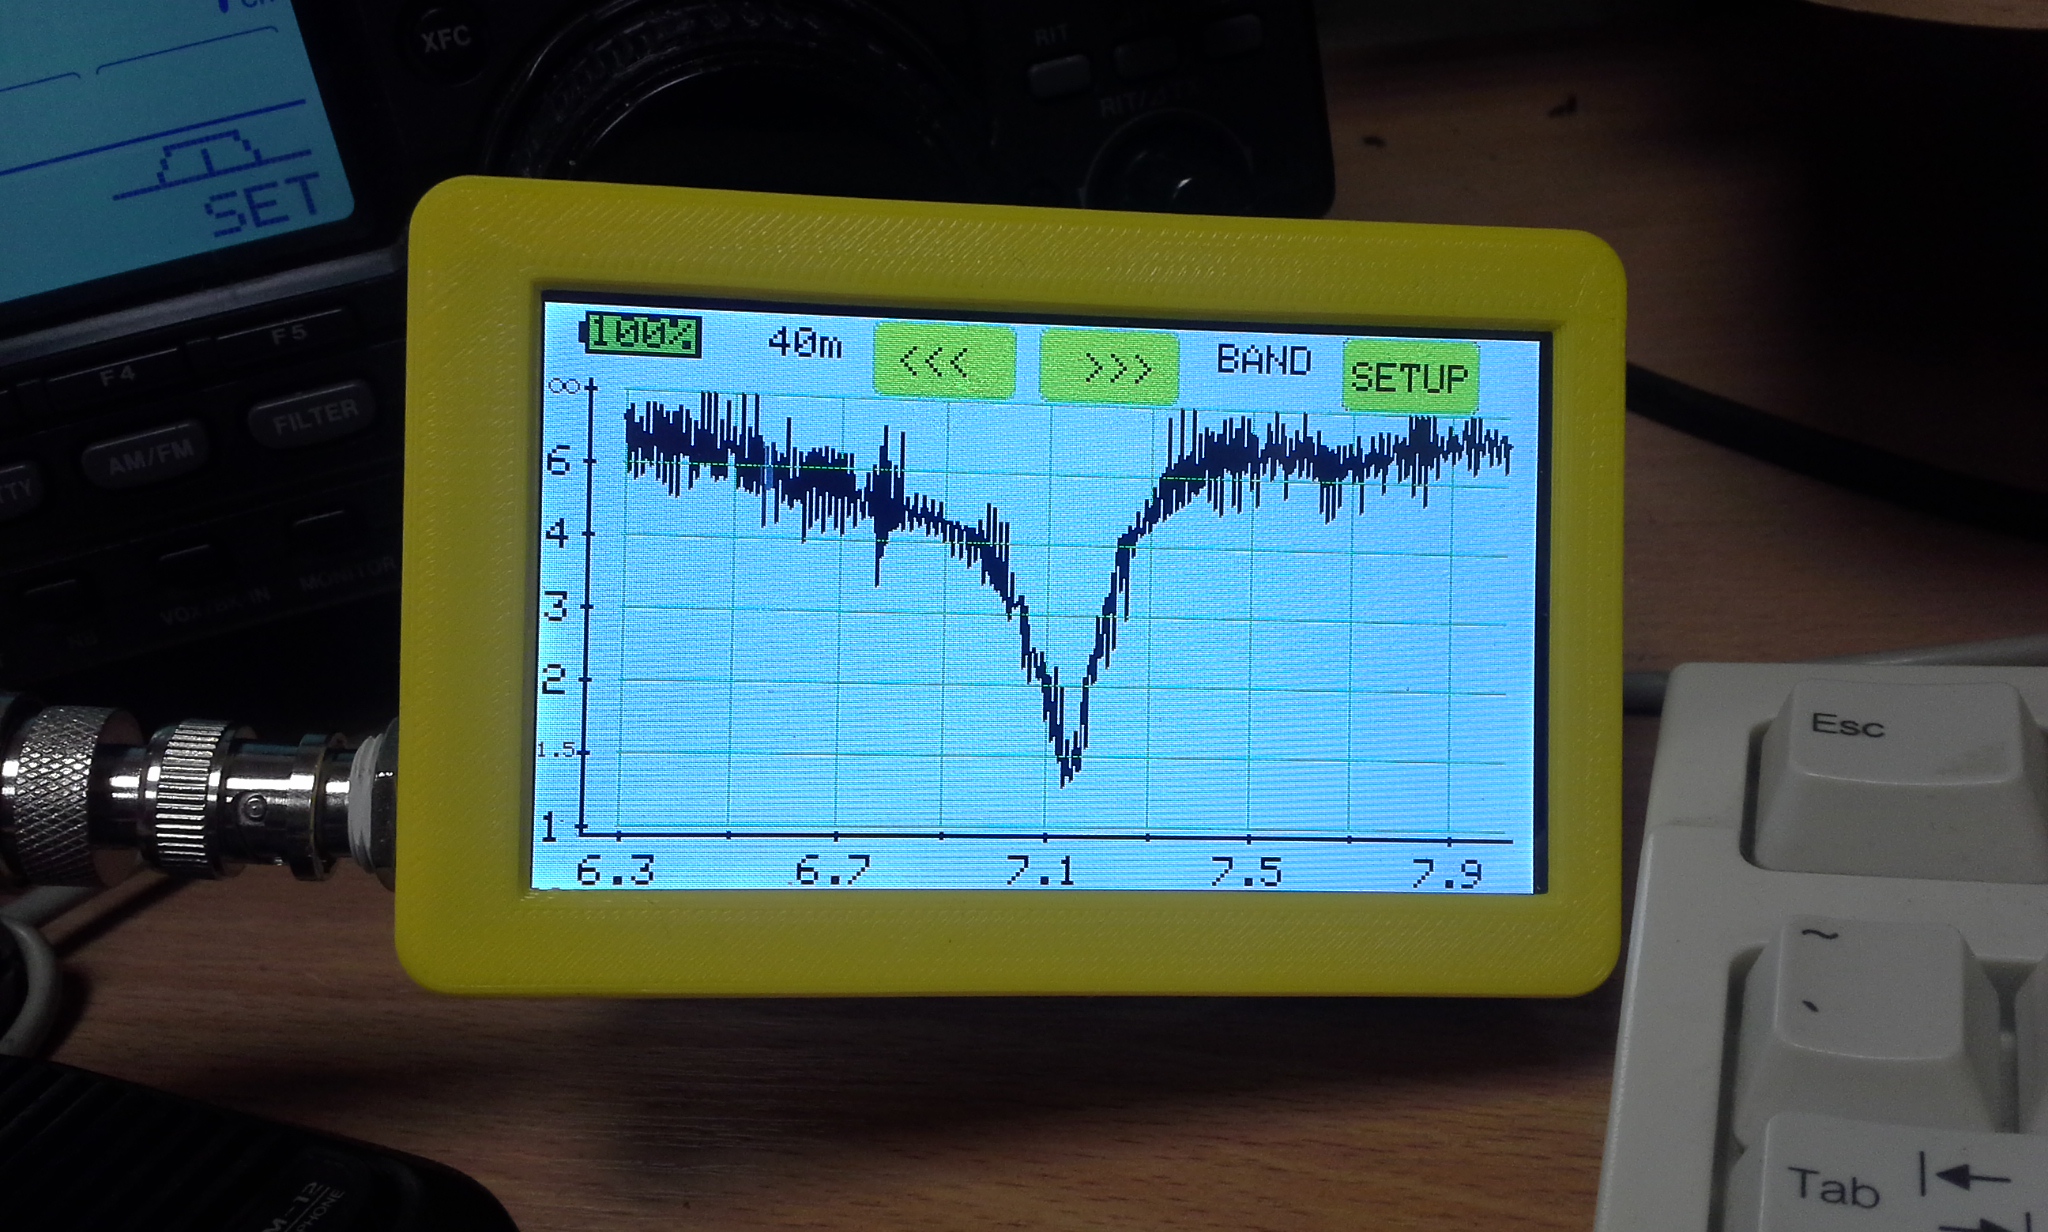
GP7 40m
Massacre, more noise than signal, it will have to be removed and repaired in the spring.
And this is my delta 83m at a height of 40m above the ground.
EndFed twenty meter long during activation SPFF0773
schematic